You can access the distribution details by navigating to My pre-printed books > Distribution
HANDBOOK | 7 QC TOOLS (eBook)
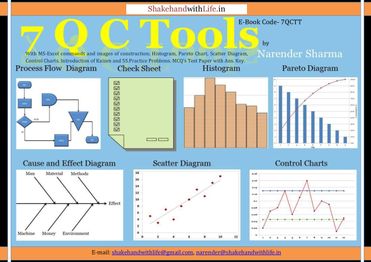
A Complete Training and Reference Guide with Excel Images and Commands
Description
Using this book you will learn and apply the 7 basic tools of quality effectively under various continuous improvement methodologies like Six Sigma DMAIC, SPC, PDSA/PDCA, KAIZEN, TPM, TQM, for problem-solving to achieve operational excellence.
Using this book you will understand the way to draw a PROCESS FLOW CHART to identify the value-added and non-value added activities in an actual process step-by-step with colorful graphics and you'll also learn how to calculate the process efficiency for the given process.
A process flow chart helps to identify the problem in the process that reduces the efficiency of the process and hence impacts the output of the process.
Using this book You will get how to prepare a CHECK SHEET step-by-step with an example, and the use of a check sheet for data collection for defects and defectives.
Check sheet gives you a clear picture of the problem in numerical form and helps you to make a better decision to move on in the direction of problem-solving.
Using this book you will train yourself to draw the HISTOGRAM step-by-step with colorful graphics and Excel commands both manually and in excel for grouped and ungrouped data.
The histogram helps to understand the symmetry of the data, the spread of the data, and the concentration of most of the data points and identify the gap between the average of the data points and the target value.
Using this book you will catch the method to draw a PARETO CHART both manually and in excel step-by-step through the colorful graphics and Excel commands with an example problem and sample data.
You will understand how to prioritize the 20% vital few items responsible for 80% of the problem using the Pareto chart.
The Pareto chart helps to target the vital few causes to reduce the 80% impact of the problem.
Using this book, you will find out the way to draw the CAUSE AND EFFECT DIAGRAM also known as the FISHBONE DIAGRAM or ISHIKAWA DIAGRAM step-by-step.
The Cause and Effect diagram helps to identify the possible causes of the problem and so to predict the potential causes of the problem leading towards the root cause of the problem.
Using this book, you will learn the way to draw the SCATTER CHART both manually and in Excel step-by-step with colorful graphics and Excel commands with example problems along with sample data.
A Scatter chart establishes the relationship between the independent variable (the cause) and dependent variables (the effect) such as perfect positive correlation, or perfect negative correlation.
You will also learn the way to calculate the value of the relationship between independent and dependent variables given by the coefficient of correlation denoted by 'r'.
Using this book, you will coach yourself to draw the CONTROL CHARTS such as MEAN CHART and RNAGE CHART both manually and in Excel with example problem with sample data through the colorful graphics and Excel commands.
You can use the control charts to control the process within control limits, specifically, the mean chart is used to maintain the accuracy and the range chart is used to maintain the precision of the data.
The concept of accuracy and precision is also be elaborated using the Bow-Arc analogy.
Using this book you will prepare yourself to face any interview for junior, middle, and senior-level positions, and you can answer any question based on the application of 7 QC Tools for problem-solving with full confidence and without any hesitation.
The eBook provides you the opportunity to practice the use of QC tools with help of a project and practice problems with a test paper of 60 multiple-choice questions with an answer key.
In this book, You will also have the introduction of the 5S methodology and kaizen to enhance your knowledge base.
About the Author
Book Details
Ratings & Reviews

Currently there are no reviews available for this book.
Be the first one to write a review for the book HANDBOOK | 7 QC TOOLS.
Other Books in Engineering
David M Brohn
Dr. S.G Ibrahim
Manoj Dole
Sachin Kodagali, Santosh Avvannavar


